Choose a widget
For: implementers. Setup: widget and setting names are the ModularIoT ones; the rest applies to any setup.
You will learn to:
- find the widget that matches a design;
- know whether a widget reads one row or all rows of its query;
- choose between Stacked Stat and a pie or bar chart.
From design to widget
Find what your design shows in the first column.
| The design shows | Widget | componentId |
|---|---|---|
| A large number, with an icon or a title | Stat Card | stat_icon |
| A number with a color status (green, yellow, red) | Status Card | stat_status |
| A KPI per state and a 100% bar split by state | Stacked Stat, type Bar | stat_stacked |
| The same, as a donut | Stacked Stat, type Donut | stat_stacked |
| Progress toward a goal | Progress Stat, Progress or Circular Stat | stat_progress, percentage_value, stat_circular |
| A number with a small line. In ModularIoT the line points are typed in the settings | Sparkline Stat | stat_sparkline |
| A number compared with the previous period | Detailed Stat | stat_detailed |
| Bars per category, with axes | Chart v2, Cartesian family, bar representation | chart_v2 |
| A ranking: the top N by number of events | Chart v2, Horizontal Bars | chart_v2 |
| A daily or monthly trend | Chart v2, line representation, X-Axis is a Date | chart_v2 |
| Bars stacked by month and state | Chart v2, several bar representations with Stacked | chart_v2 |
| Bars and a line in another unit | Chart v2, bar + line, Dual Y-Axis | chart_v2 |
| A pie with the distribution by category | Chart v2, Pie family | chart_v2 |
| A value within a range (speedometer) | Chart v2, Gauge family | chart_v2 |
| A list to review row by row | Data Table V2 | data_table_v2 |
| One card per row, with badges | Data List | data_list |
| Text or a section title | Text Card | text_card |
| Click a chart to filter a table | Not available. Use a dashboard select filter | — |
The names are the ones in the ModularIoT UI. The componentId is what the document stores and what other setups use.
One row or all rows
Each widget reads its query in one of two ways. Write the query to match.
| Reads | Widgets | The query returns |
|---|---|---|
| Only the first row | Text Card, Info Card, every Stat, Progress, Stacked Stat, Chart v2 Gauge | One row. One column per number the widget shows. |
| All rows | Data Table, Data Table V2, Data List, Chart v2 Cartesian and Pie | One row per item: per table row, per bar or per slice. |
Stats, Stacked Stat and Text Card use templates: {{pendiente}} is replaced by the value of the pendiente column in the first row. The Gauge reads its representation’s column in the first row. If the query returns more rows, the widget ignores them.
Pitfall: if a query returns one row per state (estado, cantidad), a Stacked Stat only sees the first state. Write the query with one column per state. Queries for widgets shows how.
Stacked Stat, pie or bars
All three show the parts of a total.
| Stacked Stat | Chart v2 Pie | Chart v2 Bars | |
|---|---|---|---|
| Categories | Fixed, typed in the settings | One per query row | One per query row |
| Color of each category | Fixed, one per category | From the color list, in row order | One per series; the bars of a series share a color |
| Query shape | One row, one column per category | One row per category: name column + value column | One row per category: X-axis column + one column per series |
| 100% bar | Yes. Each part is its value over the sum | No | No. For 100%, compute percentages in the query |
| KPI shown per category | Yes, in the legend | On hover. Slice labels show only the name | With Labels on the representation |
| Click filters another widget | No | No | No |
| Stacked Stat | Chart v2 Pie | Chart v2 Bars, one color per state |
|---|---|---|
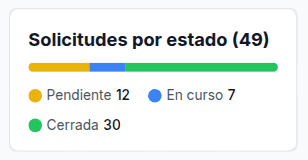 | 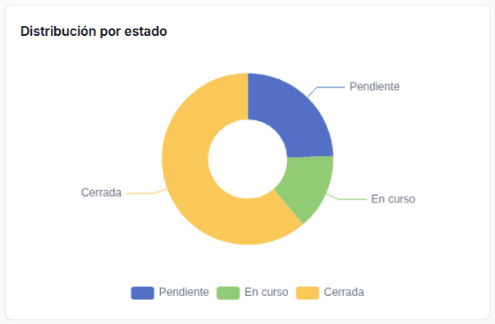 | 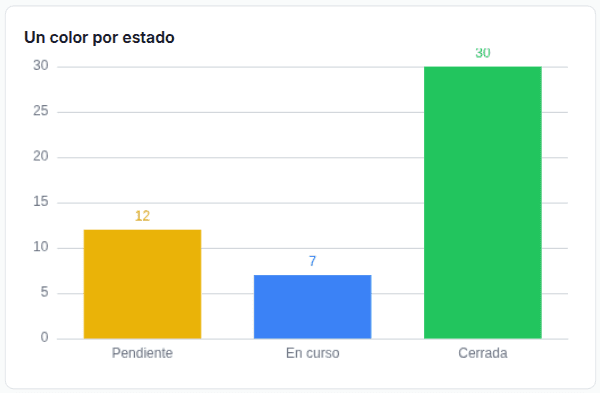 |
Use Stacked Stat when you know the states in advance and each has a fixed color. Use the pie or bars when the categories change with the data.
Colors per category in Chart v2
Chart v2 assigns one color per series:
| Chart | What gets a color |
|---|---|
| Bars or lines | Each representation (series). A series color is customColors[i], where i is its position. If missing, the chart’s color list at that position. In ModularIoT, once a representation has a color, that list is customColors: give every representation a color. |
| Pie | Each slice, in row order, from the chart’s color list: customColors when colorPalette is custom and the list is not empty; otherwise the colorPalette palette. ModularIoT always saves custom. |
| Any, with color rules | A point or slice whose numeric value matches the rule. A rule does not compare the category name. |
In the ModularIoT setup, the color picker of each representation writes customColors[i]. A pie has one representation:
| If you | The pie shows |
|---|---|
| Leave the representation color alone | Each slice in a default palette color, in row order |
| Pick a color for the representation | Every slice in that color |
To fix one color per state in a pie, edit the document (Import and export):
- Export the dashboard.
- In the widget, check that
colorPaletteis"custom"and write one color per slice incustomColors, in row order. - Import the file.
- Sort the query rows in a fixed order. If a state has no rows, the colors shift.
For bars with one color per state: return one column per state and create one representation per column, each with its color. See Queries for widgets.
Next
Queries for widgets: the exact query shape for each widget.