Stacked Stat
For: implementers. componentId: stat_stacked. Setup: setting names match the ModularIoT web app.
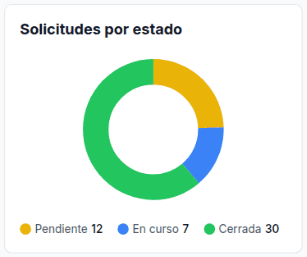
Shows the parts of a total as a 100% bar or a donut, with a legend that gives each part’s value. Use it for “a KPI per state + a 100% bar”.
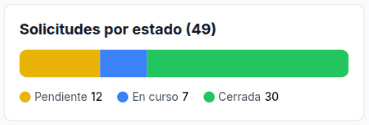
Data it reads
It reads the first row of its query. Each category reads one column of that row through a template:
SELECT
  COUNT(*) AS total,
  COUNTIF(estado = 'pendiente') AS pendiente,
  COUNTIF(estado = 'en_curso')  AS en_curso,
  COUNTIF(estado = 'cerrada')   AS cerrada
FROM `my-project.operations.solicitudes`| Category | Value |
|---|---|
| Pending | {{pendiente}} |
| In progress | {{en_curso}} |
| Closed | {{cerrada}} |
If your query returns one row per state, turn it into columns: Pivot.
Variants
| Variant | Settings | Query shape | Screenshot |
|---|---|---|---|
| Bar | Chart Type: Bar, Unit empty | One row, one column per category | Bar |
| Donut | Chart Type: Donut, Unit empty | The same | Donut |
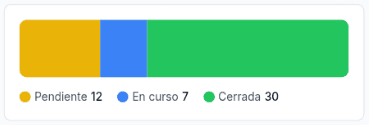
| No header | Show Header off | The same | No header |
| Percentages | Unit: %, values {{pendiente_pct}} | One row with percentages computed in the query | Percentages |
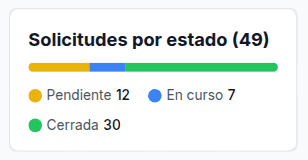
| Templated title | Title: Requests by state ({{total}}) | One row with a total column | Templated title |
Bar
Donut
No header
Percentages
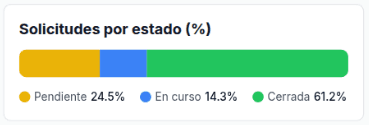
The query computes the percentages. See Percentages.
Templated title
Settings
| Tab | Setting | Document key | Effect |
|---|---|---|---|
| Visualization | Show Header | showHeader | Shows or hides the title. On by default |
| Visualization | Chart Type: Bar / Donut | chartType (bar, donut) | Chart shape |
| Visualization | Title | title | Accepts templates |
| Visualization | Unit | unit | Text after each value, with no space. Default % |
| Visualization | Categories | items[]: label, value, color | One part per category. color in hex without # |
| Visualization | Thresholds | thresholds | Saved, but the widget does not use it |
| Data Provider | Data Source, Variable | dataMode, plannerVariableName | planner reads a saved query |
| Panel footer | Auto-Refresh | refreshInterval | Seconds between reloads. Use dashboard setting removes the key |
How the bar is computed
| Case | Result |
|---|---|
| Positive values | Each part is its value over the sum of the positive values |
| Value 0 or negative | No part is drawn. The legend shows the value |
| Value that is not a number | Treated as 0 |
| Every value 0 | The bar is grey |
| Color that is not a 6-digit hex | Grey (9ca3af) |
Hovering a part shows the label, the value with the unit and the percentage with one decimal: Pendiente: 12 (24.5%).
Full example
{
  "componentId": "stat_stacked",
  "config": {
    "title": "Solicitudes por estado ({{total}})",
    "unit": "",
    "showHeader": true,
    "chartType": "bar",
    "dataMode": "planner",
    "plannerVariableName": "resumen",
    "items": [
      { "label": "Pendiente", "value": "{{pendiente}}", "color": "eab308" },
      { "label": "En curso", "value": "{{en_curso}}", "color": "3b82f6" },
      { "label": "Cerrada", "value": "{{cerrada}}", "color": "22c55e" }
    ]
  }
}
Limits
Pitfall: in the ModularIoT setup, category templates resolve only when Data Source is Planner. With static data (only possible by importing a document with staticData) or a query with no rows, {{pendiente}} shows as 0. The title and unit always resolve.
| Limit | Alternative |
|---|---|
| Reads only the first row | Pivot the query: one column per category |
| Categories are fixed. A new state does not appear on its own | Add the column and the category |
| The legend is a list. There are no cards per category | Add a Stat Card per state with the same variable and Value {{pendiente}} |
| Clicking a part does not filter other widgets | Use a dashboard select filter |
| The Data Provider tab has no static JSON editor | Use a saved query |
color is hex without # (eab308) | In Chart v2, customColors takes # |
Category templates do not read {{filter.…}} | Put the filter value in the title |