Queries for widgets
For: implementers. Setup: setting names are the ModularIoT ones; the queries apply to any setup.
You will learn to:
- write the query for a table, a single-value widget and a chart;
- turn rows into columns (pivot) for a Stat or a Stacked Stat;
- compute percentages in the query;
- give each state its own color in a bar chart;
- receive filter values as parameters.
The examples use BigQuery SQL and a solicitudes (requests) table with the columns id, estado (state), responsable (owner) and creada_en (created at). With PostgreSQL, write the same query shape in PostgreSQL SQL (for example COUNT(*) FILTER (WHERE …), NULLIF, to_char) inside a function published by PostgREST.
One row or all rows
Each widget reads its query in one of two ways:
| Family | Reads | The query returns |
|---|---|---|
| Tables and lists | All rows | One row per table row |
| Single value: Stat, Progress, Stacked Stat, Text Card, Chart v2 Gauge | Only the first row | One row, one column per number |
| Charts: Chart v2 Cartesian and Pie | All rows | One row per X-axis category: the X-axis column and one column per series |
Column names are the names the widget uses. Write a short alias with AS, without spaces or accents: AS en_curso.
Tables: many rows
SELECT
  id, estado, responsable,
  FORMAT_TIMESTAMP('%Y-%m-%d %H:%M', creada_en, 'America/Santiago') AS creada_en
FROM `my-project.operations.solicitudes`
ORDER BY creada_en DESC
LIMIT 500| Widget setting | Value |
|---|---|
| Data Source | Planner |
| Variable | the result name, for example detalle |
| Columns | filled in from the query columns |
Turn dates into text with FORMAT_TIMESTAMP. A TIMESTAMP column reaches the table as a number (1.7933364E9).
Write ORDER BY and LIMIT in the query. The table’s sorting and column filters work only on the rows the query returned.
Single value: the first row
A Stat shows one value from the first row. The widget names it with a template:
SELECT COUNT(*) AS abiertas
FROM `my-project.operations.solicitudes`
WHERE estado != 'cerrada'| Widget setting | Value |
|---|---|
| Title | Open requests |
| Value | {{abiertas}} |
{{abiertas}} and {{row.abiertas}} are the same. Both read the abiertas column of the first row.
Pivot: one column per state
A query with GROUP BY estado returns one row per state:
| estado | cantidad |
|---|---|
| pendiente | 12 |
| en_curso | 7 |
| cerrada | 30 |
A single-value widget only sees the first row (pendiente, 12). To show all three states, the query returns one row with one column per state:
SELECT
  COUNT(*) AS total,
  SUM(CASE WHEN estado = 'pendiente' THEN 1 ELSE 0 END) AS pendiente,
  SUM(CASE WHEN estado = 'en_curso'  THEN 1 ELSE 0 END) AS en_curso,
  SUM(CASE WHEN estado = 'cerrada'   THEN 1 ELSE 0 END) AS cerrada
FROM `my-project.operations.solicitudes`| total | pendiente | en_curso | cerrada |
|---|---|---|---|
| 49 | 12 | 7 | 30 |
In BigQuery, COUNTIF(estado = 'pendiente') does the same as SUM(CASE …), except on an empty table: SUM returns NULL and COUNTIF returns 0.
A Stacked Stat with this query uses one category per column:
| Label | Value | Color |
|---|---|---|
Pending | {{pendiente}} | yellow |
In progress | {{en_curso}} | blue |
Closed | {{cerrada}} | green |
The widget draws each part as its value over the sum of the positive values. The bar fills 100% when at least one value is above 0. The legend shows the values.
Pitfall: the states are written in the query and in the settings. If a new state appears in the data, it is not shown until you add its column and its category.
Percentages
To show percentages instead of counts, compute them in the query:
WITH c AS (
  SELECT
    COUNT(*) AS total,
    COUNTIF(estado = 'pendiente') AS pendiente,
    COUNTIF(estado = 'en_curso')  AS en_curso,
    COUNTIF(estado = 'cerrada')   AS cerrada
  FROM `my-project.operations.solicitudes`
)
SELECT
  total,
  ROUND(100 * SAFE_DIVIDE(pendiente, total), 1) AS pendiente_pct,
  ROUND(100 * SAFE_DIVIDE(en_curso,  total), 1) AS en_curso_pct,
  ROUND(100 * SAFE_DIVIDE(cerrada,   total), 1) AS cerrada_pct
FROM c
In the Stacked Stat, use {{pendiente_pct}} as the value and % as Unit. SAFE_DIVIDE returns NULL instead of an error when total is 0. The widget shows 0.
To round inside the widget, use a template helper: {{toFixed pendiente_pct 0}}.
Charts: X column + one column per series
Chart v2 draws one X-axis category per row. Each representation (series) reads one column.
Bars by state
SELECT estado, COUNT(*) AS cantidad
FROM `my-project.operations.solicitudes`
GROUP BY estado
ORDER BY cantidad DESC| Setting | Value |
|---|---|
| Chart Family | Cartesian |
| X-Axis Column | estado |
| Representations | one bar, column cantidad |
All bars have the color of the cantidad series.
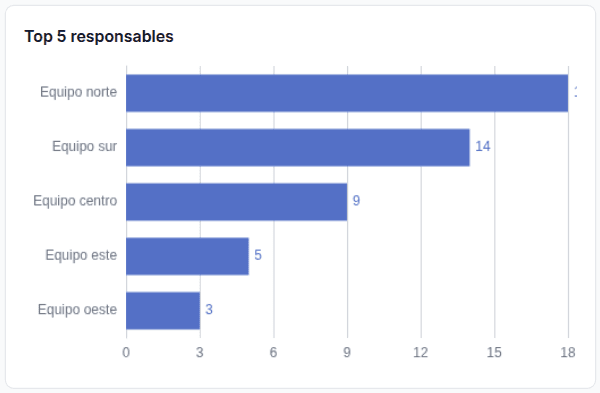
Top N as a horizontal bar
SELECT responsable, COUNT(*) AS cantidad
FROM `my-project.operations.solicitudes`
GROUP BY responsable
ORDER BY cantidad DESC
LIMIT 10
Turn on Horizontal Bars. The first row is at the top.
Bars stacked by month and state
One series per state, one row per month:
SELECT
  FORMAT_DATE('%Y-%m', DATE(creada_en)) AS mes,
  COUNTIF(estado = 'pendiente') AS pendiente,
  COUNTIF(estado = 'en_curso')  AS en_curso,
  COUNTIF(estado = 'cerrada')   AS cerrada
FROM `my-project.operations.solicitudes`
GROUP BY mes
ORDER BY mes| Setting | Value |
|---|---|
| X-Axis Column | mes |
| Representations | three bars: pendiente, en_curso, cerrada, each with Stacked and its color |
Stacked bars show counts. For 100% bars, return percentages per month, as in Percentages.
One color per state in bars
A bar chart colors by series. To give each state its own color, return one column per state. Leave the other columns empty:
SELECT
  estado,
  IF(estado = 'pendiente', COUNT(*), NULL) AS pendiente,
  IF(estado = 'en_curso',  COUNT(*), NULL) AS en_curso,
  IF(estado = 'cerrada',   COUNT(*), NULL) AS cerrada
FROM `my-project.operations.solicitudes`
GROUP BY estado| estado | pendiente | en_curso | cerrada |
|---|---|---|---|
| pendiente | 12 | ||
| en_curso | 7 | ||
| cerrada | 30 |
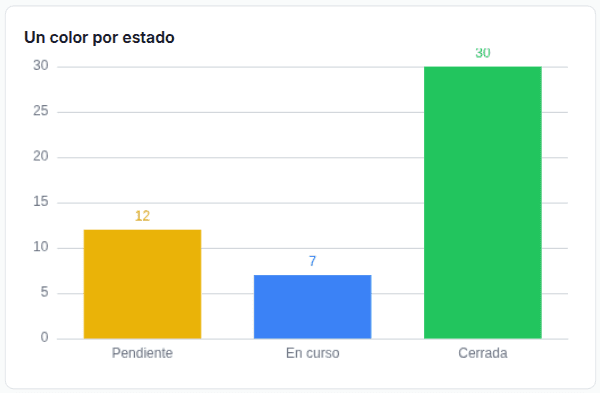
Create three bar representations, one per column. Give each its color. Turn on Stacked on all three. With Stacked, each bar is centered on its category. Without it, the chart reserves room for the three series in every category.
Chart v2 color rules compare only the numeric value (for example, “greater than 20 → red”). They cannot pick a color by category name.
Pie
SELECT estado, COUNT(*) AS cantidad
FROM `my-project.operations.solicitudes`
GROUP BY estado
ORDER BY CASE estado WHEN 'pendiente' THEN 1 WHEN 'en_curso' THEN 2 ELSE 3 END| Setting | Value |
|---|---|
| Chart Family | Pie |
| Category Column | estado |
| Representations | one, column cantidad |
Slices take colors in row order. A fixed ORDER BY keeps the same color for each state while every state has rows. Details in Choose a widget.
Gauge
The gauge reads the first row, like a Stat:
SELECT ROUND(100 * SAFE_DIVIDE(COUNTIF(estado = 'cerrada'), COUNT(*)), 1) AS cerradas_pct
FROM `my-project.operations.solicitudes`| Setting | Value |
|---|---|
| Chart Family | Gauge |
| Representations | one, column cerradas_pct |
Filters as parameters
A dashboard filter reaches the query as a parameter. In BigQuery, a parameter is written @name and declared with a type in the query editor.
Bind filters to parameters in the dashboard’s saved query, in Parameters (JSON):
{
  "estado": { "kind": "filter", "key": "estado", "defaultValue": "" },
  "desde": { "kind": "filter", "key": "fecha_from", "defaultValue": "" },
  "hasta": { "kind": "filter", "key": "fecha_to", "defaultValue": "" }
}
The object key (estado, desde) is the parameter name in the query. key is the filter key in the dashboard.
| Filter type | Values it provides | Example value |
|---|---|---|
| Text | <key>. In ModularIoT, several values separated by commas | north or north,south |
| Date range | <key>_from and <key>_to | 2026-10-01 00:00:00 and 2026-10-31 23:59:59 |
| Selection, one option | <key> | en_curso |
| Selection, several options | <key>, values separated by commas (ModularIoT setup) | pendiente,en_curso |
In the ModularIoT setup, every value arrives as text. Declare the parameters as STRING and convert them in the query:
SELECT id, estado, responsable, creada_en
FROM `my-project.operations.solicitudes`
WHERE (IFNULL(@estado, '') = '' OR estado IN UNNEST(SPLIT(@estado, ',')))
  AND (IFNULL(@desde, '') = '' OR creada_en >= TIMESTAMP(@desde, 'America/Santiago'))
  AND (IFNULL(@hasta, '') = '' OR creada_en <= TIMESTAMP(@hasta, 'America/Santiago'))
ORDER BY creada_en DESC
LIMIT 500| Part | Does |
|---|---|
IFNULL(@estado, '') = '' | With no filter, lets every row through. The editor sends NULL when the test value is empty. The dashboard sends defaultValue. |
SPLIT(@estado, ',') | Accepts one option or several |
TIMESTAMP(@desde, 'America/Santiago') | Reads the date in the given time zone. Use yours. |
Pitfall: with BigQuery, every declared parameter must receive a value. Use defaultValue. With omitWhenEmpty, the parameter is left out when the filter is empty and the query fails. omitWhenEmpty is for PostgREST functions whose parameters have a default value.
A filter does not change a widget if the widget’s query does not bind that filter. For the Stacked Stat and the table to respond to the same filter, bind the filter in both queries.
Limits
| Limit | Default |
|---|---|
| Rows per query | 5,000 |
| Columns per row | 100 |
| Result size | 2 MiB of JSON |
| Time | 20 seconds |
| Text per value | 2,048 characters |
A result over any limit makes the query fail. Rows are not truncated.
Values must be text, numbers, true/false or NULL. With BigQuery, an ARRAY, STRUCT or RECORD column makes the query fail: convert it with TO_JSON_STRING or select its fields. NULL reaches the widget as empty text. A TIMESTAMP column arrives as a number: convert it with FORMAT_TIMESTAMP.
Next
- Try these queries in a dashboard: Build your first dashboard.
- Every filter type: Add filters.
- How a query runs: Queries and connections.