Recipe: one color per state
For: implementers. Setup: ModularIoT.
Result: each state always shows in the same color, in the summary, in a bar chart and in the table.
| State | Color |
|---|---|
| Pending | eab308 (yellow) |
| In progress | 3b82f6 (blue) |
| Closed | 22c55e (green) |
| Widget | How the color is fixed |
|---|---|
| Stacked Stat | One color per category in the settings |
| Chart v2 bars | One series per state, each with its color |
| Data Table V2 | One color rule per state on the column |
| Chart v2 pie | Only by editing the document |
Stacked Stat
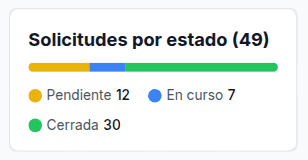
Each category has its color. See Recipe: KPI per state and a 100% bar.
Bars with one color per state
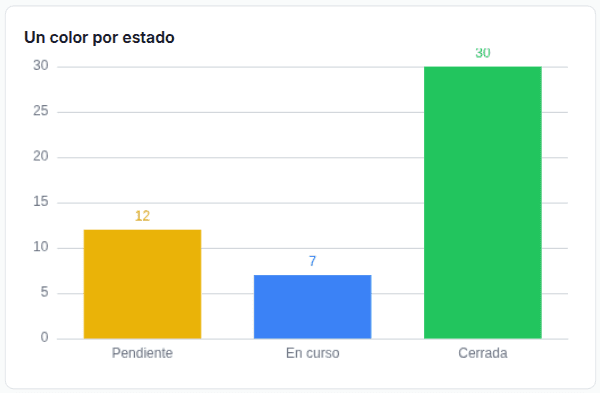
A bar chart colors by series. The query returns one column per state, with a value only in its state’s row. It assumes three states. Save it as barras_por_estado:
SELECT
  CASE estado WHEN 'pendiente' THEN 'Pending' WHEN 'en_curso' THEN 'In progress' ELSE 'Closed' END AS etiqueta,
  IF(estado = 'pendiente', COUNT(*), NULL) AS pendiente,
  IF(estado = 'en_curso',  COUNT(*), NULL) AS en_curso,
  IF(estado = 'cerrada',   COUNT(*), NULL) AS cerrada
FROM `my-project.operations.solicitudes`
GROUP BY estado
ORDER BY CASE estado WHEN 'pendiente' THEN 1 WHEN 'en_curso' THEN 2 ELSE 3 END-
Add the saved query Result name
barras, Operationbarras_por_estado. -
Add Widget › Chart v2. Data Provider: Planner, Variable
barras. -
Visualization:
Setting Value X-Axis Column etiquetaRepresentations The widget comes with a bar and a line. Change the line to Bar and add a third with Add representation. Columns pendiente,en_curso,cerrada, with the colors from the table above. All three with Stacked and LabelsShow Legend Off -
Save.
With Stacked, each bar is centered on its category. Give all three representations a color.
Table with the state in color
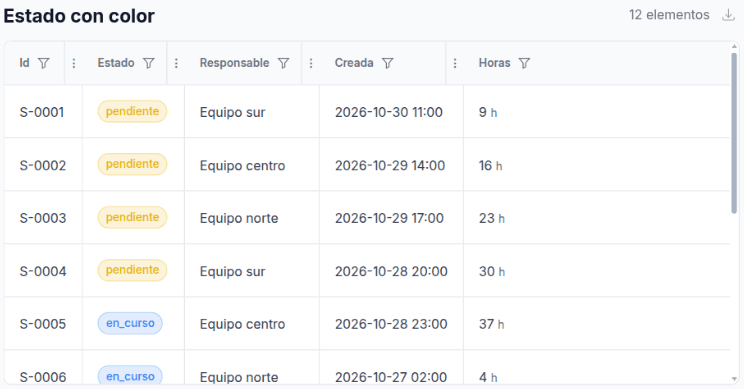
On the Estado column: type badge, paintbrush on and one = rule per state. See Data Table V2.
Pie
In a pie, choosing a color for its representation paints every slice that color (#2240 ). If you already chose one, delete the representation and add it again.
To fix one color per state in the pie, edit the document (Import and export): "colorPalette": "custom", "customColors": ["#eab308", "#3b82f6", "#22c55e"], and sort the rows with the same ORDER BY as above. If a state has no rows, the colors shift.