Recipe: top N as a horizontal bar
For: implementers. Setup: ModularIoT.
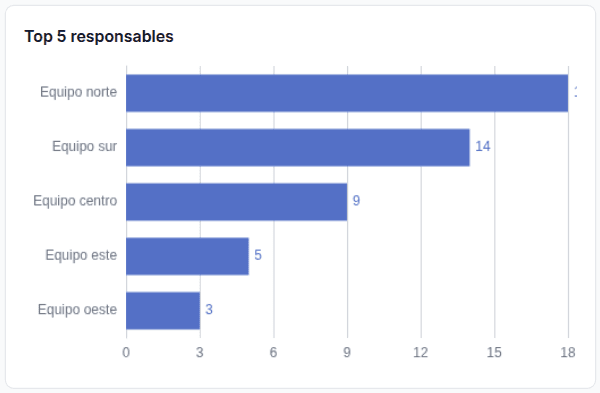
Result: a ranking of the 5 owners with the most requests, from highest to lowest, with the value at the end of each bar.
Before you start
| Step | Where |
|---|---|
| Save each SQL query with a name | Settings › Connections › BigQuery › + New › Save |
| Add a saved query to the dashboard | With Edit Mode on: settings menu (gear) › Saved queries › Add query. Connection: your BigQuery connection. Operation: the SQL query’s name |
| Add a widget | With Edit Mode on: Add Widget |
The full walkthrough is in Build your first dashboard.
Query
SELECT responsable, COUNT(*) AS cantidad
FROM `my-project.operations.solicitudes`
GROUP BY responsable
ORDER BY cantidad DESC
LIMIT 5
Save it as top_responsables. The chart does not sort: the order comes from ORDER BY. The first row is at the top.
Steps
-
Turn on Edit Mode. Add the saved query Result name
top, Operationtop_responsables, Parameters (JSON){}. -
Add Widget › search
Chart› Chart v2. Data Provider: Planner, Variabletop. -
Visualization:
Setting Value Title Top 5 ownersChart Family Cartesian X-Axis Column responsableRepresentations The widget comes with two (bar and line). Delete the line. On the bar: column cantidad, labelRequests, Labels onHorizontal Bars On Show Legend Off -
Save.
Variants
| You want | Change |
|---|---|
| The top 10 | LIMIT 10 and a taller widget |
| The bottom (fewest requests) | ORDER BY cantidad ASC |
| Color by value | Colors & Rules: for example > 10 red. See Chart v2 |
| Long names | They are cut at 120 pixels. Shorten them in the query |
The label of the longest bar can be cut at the right edge, as in the screenshot (#2246 ).
Related
Last updated on