Chart v2
For: implementers. componentId: chart_v2. Setup: setting names match the ModularIoT web app.
Bar, line, scatter, pie and gauge charts. One chart can mix bars and lines, stack series and use two Y axes.
Data it reads
| Family | Reads | Query shape |
|---|---|---|
| Cartesian (bars, lines, scatter) | All rows, in their order | One row per X-axis category. One column per series |
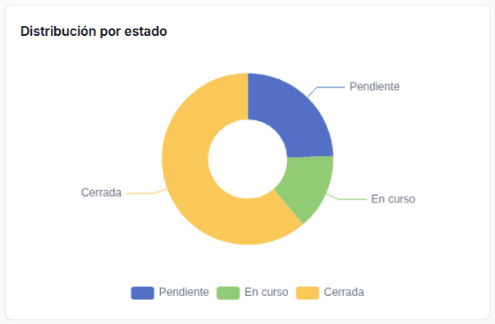
| Pie | All rows, in their order | One row per slice: name column + value column |
| Gauge | The first row | One row with a numeric column |
The chart does not sort or group rows: use ORDER BY and GROUP BY in the query. An empty or non-numeric value leaves a gap.
Variants
| Variant | Settings | Query shape | Screenshot |
|---|---|---|---|
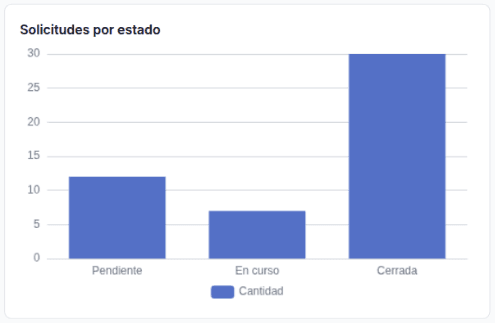
| Bars | Cartesian family, one Bar representation | estado, cantidad | Bars |
| Horizontal bars (top N) | Horizontal Bars, Labels | responsable, cantidad with ORDER BY cantidad DESC LIMIT 5 | Horizontal bars |
| Stacked bars | One representation per state, all with Stacked | mes, pendiente, en_curso, cerrada | Stacked bars |
| Line with date | Line representation, Smooth, X-Axis is a Date | fecha, cantidad | Line |
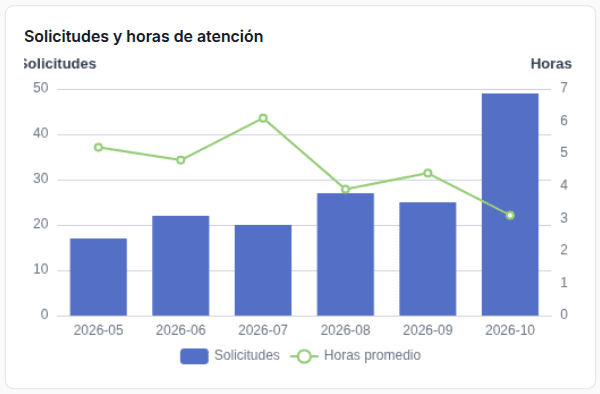
| Bars + line, dual axis | Dual Y-Axis; the line on axis R | mes, solicitudes, horas | Dual axis |
| Pie | Pie family | estado, cantidad | Pie |
| Gauge | Gauge family | One row: cerradas_pct | Gauge |
| One color per state | X-Axis Column estado. One representation per state, all with Stacked, Labels and their own color. Show Legend off | One row per state. Only its state’s column has a value | One color per state |
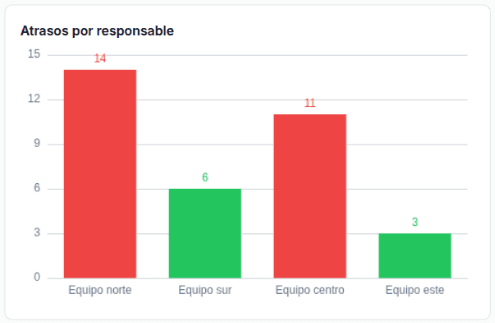
| Color rules | Colors & Rules: greater than 10 → red, up to 10 → green | responsable, atrasadas | Color rules |
| Palette | colorPalette: "warm" (document only) | mes + three columns | Palette |
Bars
Horizontal bars
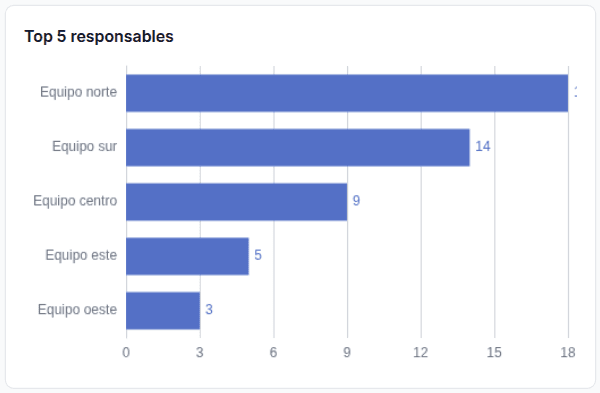
The first row is at the top. Sort the query from highest to lowest.
Stacked bars
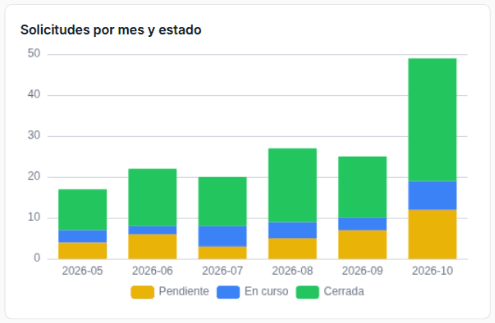
Stacked bars show counts. For 100% bars, compute percentages in the query.
Line
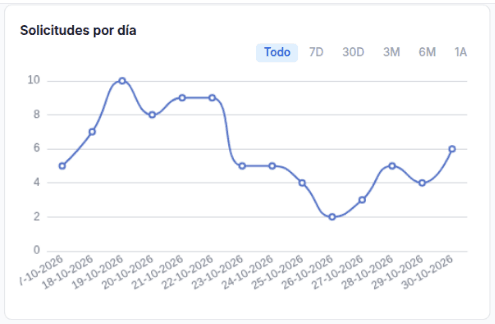
With X-Axis is a Date, the chart shows buttons to filter by range (All, 7D, 30D, 3M, 6M, 1Y; in Spanish Todo … 1A). Labels show as dd-mm-yyyy. The axis is still a category axis: it does not sort or fill days.
Dual axis
Pie
Gauge
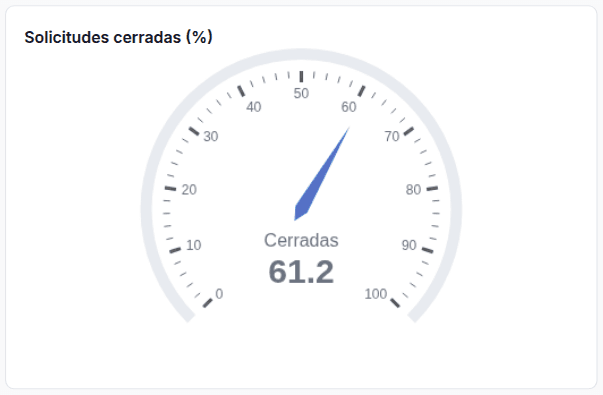
The scale goes from 0 to 100. Use a percentage.
One color per state
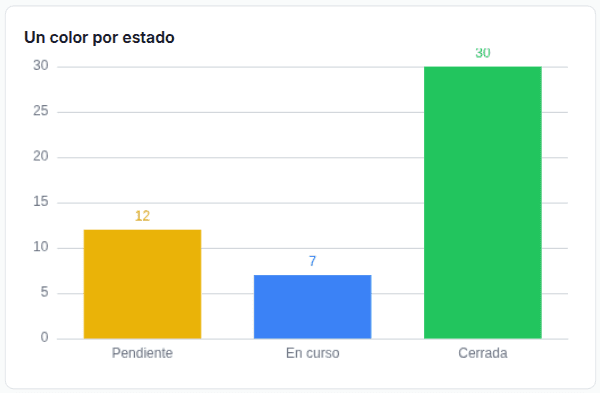
SELECT
  estado,
  IF(estado = 'pendiente', COUNT(*), NULL) AS pendiente,
  IF(estado = 'en_curso',  COUNT(*), NULL) AS en_curso,
  IF(estado = 'cerrada',   COUNT(*), NULL) AS cerrada
FROM `my-project.operations.solicitudes`
GROUP BY estado
ORDER BY CASE estado WHEN 'pendiente' THEN 1 WHEN 'en_curso' THEN 2 ELSE 3 END
With Stacked, each bar is centered on its category. Colors follow the representation order: the first color belongs to the first representation.
To show In progress instead of en_curso, convert it in the query: CASE estado WHEN 'en_curso' THEN 'In progress' … END AS estado.
Color rules
Palette
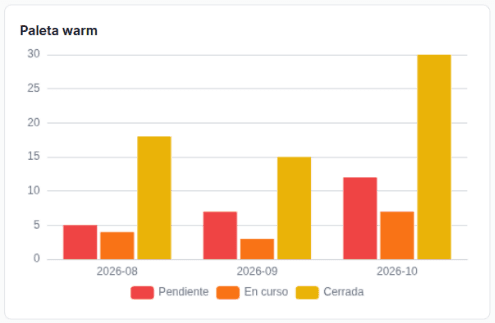
The UI has no palette selector and always saves colorPalette: "custom". A named palette (default, cool, warm, monochrome, pastel, vivid) is used only if you write it in the document (Import and export). The palette is lost when you save the widget settings in the UI.
Settings
| Section | Setting | Document key | Effect |
|---|---|---|---|
| General | Title | title | Accepts templates |
| General | Chart Family | chartFamily (cartesian, pie, gauge) | Switching to Pie or Gauge keeps only the first representation |
| Data Mapping | X-Axis Column (Pie: Category Column) | xAxisColumn | Category column. Not in Gauge |
| Data Mapping | Representations › type | representations[].type (bar, line, scatter) | Cartesian only |
| Data Mapping | Representations › column and label | columnKey, label | The label is the legend name. Accepts templates |
| Data Mapping | Representations › color | customColors[i] | Color of series i |
| Data Mapping | Smooth (line) | smooth | Smooth curve |
| Data Mapping | Stacked (line or bar) | stacked | Every series with Stacked shares one stack |
| Data Mapping | Labels (bar) | showLabels | Value on each bar |
| Data Mapping | L / R (with dual axis) | yAxisIndex (0, 1) | Axis of the series |
| Appearance | X-Axis Label, Y-Axis Label | xAxisLabel, yAxisLabel | Axis names |
| Appearance | Right Y-Axis Label | yAxisLabelRight | Dual axis only. Does not accept templates |
| Appearance | Show Legend | showLegend | Legend at the bottom |
| Appearance | Horizontal Bars | horizontal | Only when every representation is a bar |
| Appearance | Dual Y-Axis | dualYAxis | Second axis on the right |
| Appearance | X-Axis is a Date | xAxisDateFormat | The switch saves month. It only turns on the date axis and the range buttons |
| Colors & Rules | Value Color Rules | valueColorRules.rules[] | Color of a point by its value |
| Tooltip | Template | tooltipTemplate | Text on hover. Uses {{row.column}} |
| Data Provider | Data Source: Planner or Static | dataMode, plannerVariableName, rows | In static mode, rows go in rows |
Colors
| What | Color |
|---|---|
| A series (bars or lines) | customColors[i], with #. If missing, the chart’s color list at that position |
| A pie slice | The chart’s color list, in row order |
| A point that matches a rule | The rule’s color |
Pitfall: in a pie, if you pick a color for its only representation, every slice takes that color. Do not pick a color in a pie. For a fixed color per state, use One color per state or a Stacked Stat.
Once a representation has a color, the chart’s color list becomes customColors. Give every representation a color. The ones without a color repeat others’ colors.
Rule operators
| Field | Values |
|---|---|
| Operator | =, !=, contains, !contains, >, <, >=, <= |
| Value | Number or text |
| Color | Hex without # |
Rules compare each point’s numeric value, not the category name or another column. > and >= rules are checked from highest to lowest value, then < and <= from lowest to highest. The first match wins. On a line, the rule colors the point, not the stroke.
Tooltip
With the field empty, the tooltip shows every series at the category. With a template, it shows the text of the row under the cursor:
{{row.responsable}}: {{row.atrasadas}} lateThe template has no access to the series name or to filters.
Full example
{
  "componentId": "chart_v2",
  "config": {
    "title": "Solicitudes por mes y estado",
    "chartFamily": "cartesian",
    "xAxisColumn": "mes",
    "representations": [
      { "columnKey": "pendiente", "label": "Pendiente", "type": "bar", "stacked": true },
      { "columnKey": "en_curso", "label": "En curso", "type": "bar", "stacked": true },
      { "columnKey": "cerrada", "label": "Cerrada", "type": "bar", "stacked": true }
    ],
    "colorPalette": "custom",
    "customColors": ["#eab308", "#3b82f6", "#22c55e"],
    "showLegend": true,
    "horizontal": false,
    "xAxisLabel": "",
    "yAxisLabel": "",
    "dataMode": "planner",
    "plannerVariableName": "por_mes"
  }
}
In a Cartesian chart, always include customColors, even as []: without that key, the widget fails.
Limits
| Limit | Alternative |
|---|---|
| Clicking a bar or slice does not filter other widgets | Use a dashboard select filter |
| No color per category in the pie | One color per state or Stacked Stat |
| The gauge goes from 0 to 100 | Send a percentage |
| The date axis does not sort or fill days without data | Sort and fill the days in the query |
A date without time (2026-01-01) is read as UTC midnight and shows one day earlier in time zones west of UTC, such as America/Santiago | Send the date with a time: 2026-01-01T12:00:00 |
The palette and the initial range (defaultDateRange) are lost when you save the settings in the UI | Import them again in the document |
| The value label of the longest bar can be cut off at the edge | — |